Note
Click here to download the full example code
cleaning steps
assay tables arrive with upper-case names, sentinels such as -99 and "NS" (not sampled), detection-limit text such as
"<0.01" and grades stored as text. each cleaning step fixes one of these and returns a new container, and a Pipeline
chains them so the same cleaning runs on the next batch of assays. here the raw assays of the stacked sulphide lenses
go from text to numeric grades ready for statistics.
import sys
from pathlib import Path

HERE = Path(__file__).parent if "__file__" in globals() else Path.cwd()
sys.path.insert(0, str(HERE.parents[1]))
import boitata as bt
import numpy as np
from common import ACCENT, save

raw = bt.datasets.stacked_sulphide_lenses(raw=True)["assays"]
print(raw.column_names)
print({c: sorted({s for s in raw[c] if s is not None and not s[0].isdigit()}) for c in raw.column_names[3:8]})
Out:
['HOLE_ID', 'FROM', 'TO', 'ZN_PCT', 'PB_PCT', 'CU_PCT', 'AG_GPT', 'AU_GPT', 'DENSITY']
{'ZN_PCT': ['-999', 'NS'], 'PB_PCT': ['-99', 'NS'], 'CU_PCT': ['-999', '<0.01', 'NS'], 'AG_GPT': ['-99', 'NS'], 'AU_GPT': ['-999', '<0.01', 'NS']}
RenameColumns snake-cases the names. ToNull turns the sentinels into nulls; the grades are text, so the text forms
of -99 and -999 count too. Replace sets grades below detection to half the 0.01 limit, then ToNumber parses the
grade columns and raises if any text is left. DropNull keeps the intervals with a zinc assay.
grades = ["zn_pct", "pb_pct", "cu_pct", "ag_gpt", "au_gpt"]
clean = bt.Pipeline(
    [
        ("names", bt.RenameColumns(case="snake")),
        ("sentinels", bt.ToNull(["NS", "-99", "-999", -99, -999])),
        ("detection", bt.Replace({"<0.01": "0.005"}, columns=grades)),
        ("numbers", bt.ToNumber(grades)),
        ("zinc", bt.DropNull(columns="zn_pct")),
    ]
)
assays = clean.fit_transform(raw)
print(f"{len(raw)} intervals in, {len(assays)} with zinc")
for g in grades:
    v = assays[g]
    print(f"{g:7} {np.isnan(v).sum():5} null, mean {np.nanmean(v):.3f}")
Out:
16907 intervals in, 16905 with zinc
zn_pct      0 null, mean 0.902
pb_pct      1 null, mean 0.343
cu_pct      1 null, mean 0.152
ag_gpt      1 null, mean 8.184
au_gpt   4386 null, mean 0.221
units live in the column metadata and survive Parquet. convert_units rescales a column and relabels its unit; here
gold goes from g/t to ppb. plots label their axes with the unit.
assays = assays.with_units({"zn_pct": "%", "pb_pct": "%", "cu_pct": "%", "ag_gpt": "g/t", "au_gpt": "g/t"})
assays = assays.convert_units("au_gpt", to="ppb")
print(assays.units)
print(f"mean gold {np.nanmean(assays['au_gpt']):.0f} ppb")
Out:
{'zn_pct': '%', 'pb_pct': '%', 'cu_pct': '%', 'ag_gpt': 'g/t', 'au_gpt': 'ppb'}
mean gold 221 ppb
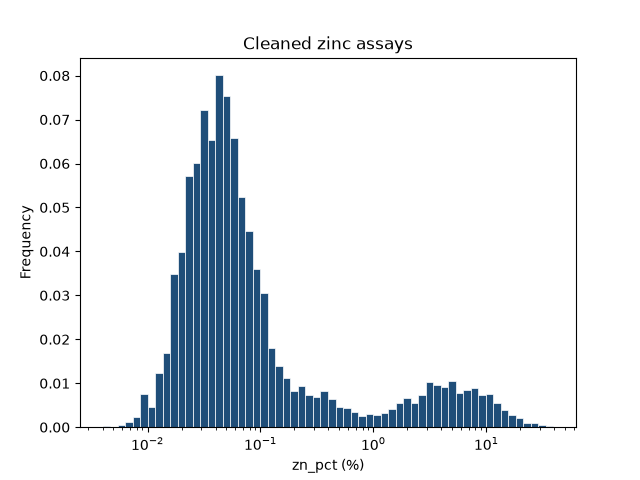
the zinc grades span three orders of magnitude; on a log axis their two populations separate.
fig, ax = bt.plot.histogram("zn_pct", data=assays, log=True, bins=60, color=ACCENT)
ax.set_title("Cleaned zinc assays")
save(fig, "zinc")
clean.to_json() saves the chain; bt.Pipeline.from_json reloads it for the next batch, and a batch missing a column
a step reads raises MissingColumn naming that step.
Total running time of the script: ( 0 minutes 0.171 seconds)
Download Python source code: example_03_14.py