Note
Click here to download the full example code
duplicates
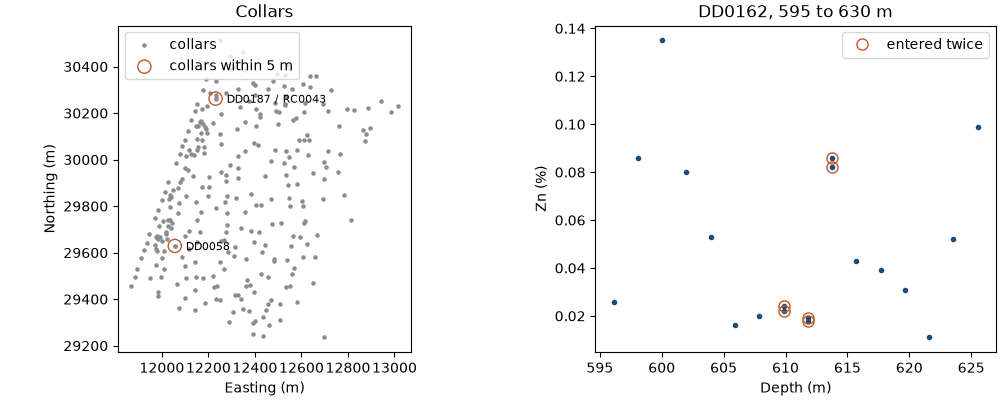
collars entered twice, holes collared next to each other and samples assayed twice put several records at one place,
and kriging cannot weight two samples at the same location. duplicates groups the samples closer than a tolerance
and merges each group. the raw tables of the stacked sulphide lenses carry such errors on purpose.
import sys
from pathlib import Path

HERE = Path(__file__).parent if "__file__" in globals() else Path.cwd()
sys.path.insert(0, str(HERE.parents[1]))
import boitata as bt
import matplotlib.pyplot as plt
import numpy as np
from common import ACCENT, GRAY, HIGHLIGHT, map_axes, save

raw = bt.datasets.stacked_sulphide_lenses(raw=True)
collars = raw["collars"]
names, counts = np.unique(collars["HOLE_ID"], return_counts=True)
print(f"{len(collars)} collars, {len(names)} hole ids, repeated: {', '.join(names[counts > 1])}")
Out:
290 collars, 288 hole ids, repeated: DD0058, DD0067
collars
a repeated id can sit at two locations. duplicates on the collar coordinates groups the collars within 5 m of
one another, transitively, and gives each group's first collar and its spread.
xyz = np.column_stack([collars["X"], collars["Y"], collars["Z"]])
close, group_collars = bt.duplicates(xyz, tolerance=5.0)
for k, spread in zip(close["group"], close["spread"], strict=True):
    print(f"{' and '.join(collars['HOLE_ID'][group_collars == k])}: {spread:.1f} m apart")
for name in names[counts > 1]:
    first, second = xyz[collars["HOLE_ID"] == name]
    print(f"{name} twice: {np.linalg.norm(first - second):.0f} m apart")
Out:
DD0058 and DD0058: 0.0 m apart
DD0187 and RC0043: 2.7 m apart
DD0058 twice: 0 m apart
DD0067 twice: 290 m apart
DD0058 is one row entered twice: drop one. DD0067 names two collars 290 m apart, an id clash that check_drillholes
flags (checking drill holes). DD0187 and RC0043 are two holes collared 2.7 m apart at
different dips. nearby holes of two drilling types are paired data.
samples
the grades of the raw assays are text, with NS, <0.01 and -999 among the numbers. here anything other than a
plain number reads as missing. the default rules of checking drill holes fix the other planted errors, except
overlaps, which stay so that the samples entered twice survive.
def number(text):
    return np.array([float(v) if str(v).replace(".", "", 1).isdigit() else np.nan for v in text])


assays = raw["assays"]
assays = bt.Table({**{c: assays[c] for c in ("HOLE_ID", "FROM", "TO")}, "ZN_PCT": number(assays["ZN_PCT"])})
tables = {"collar": collars, "survey": raw["surveys"], "assays": assays}
flags, _, _ = bt.check_drillholes(collars, raw["surveys"], {"assays": assays}, max_depth="LENGTH")
fixed, _ = bt.fix_drillholes(flags, tables, overlaps="keep")
samples = bt.Drillholes(fixed["collar"], fixed["survey"], fixed["assays"]).samples()
print(f"{len(samples)} samples at their midpoints")
Out:
16779 samples at their midpoints
with a tolerance of 0, only samples at the same location are grouped: three intervals of DD0162 were entered twice, with grades within 10 % of each other.
report, group = bt.duplicates(samples, tolerance=0.0)
zn, hole = samples["ZN_PCT"], samples["HOLE_ID"]
depth = (samples["FROM"] + samples["TO"]) / 2
for k in report["group"]:
    rows = np.flatnonzero(group == k)
    values = " and ".join(f"{v:.3f}" for v in zn[rows])
    print(f"{hole[rows[0]]} at {depth[rows[0]]:.1f} m: Zn {values} %")

fig, (a, b) = plt.subplots(1, 2, figsize=(10, 4), layout="constrained", width_ratios=[1.3, 1])
a.scatter(xyz[:, 0], xyz[:, 1], s=5, color=GRAY, label="collars")
a.scatter(close["x"], close["y"], s=90, facecolors="none", edgecolors=HIGHLIGHT, label="collars within 5 m")
for k, x, y in zip(close["group"], close["x"], close["y"], strict=True):
    a.annotate(
        " / ".join(dict.fromkeys(collars["HOLE_ID"][group_collars == k])),
        (x, y),
        (8, -3),
        textcoords="offset points",
        fontsize=8,
    )
map_axes(a, "Collars")
a.legend(loc="upper left")
rows = np.flatnonzero((hole == "DD0162") & (depth > 595) & (depth < 630))
b.plot(depth[rows], zn[rows], "o", ms=3, color=ACCENT)
twice = rows[group[rows] >= 0]
b.plot(depth[twice], zn[twice], "o", ms=8, mfc="none", color=HIGHLIGHT, label="entered twice")
b.set(title="DD0162, 595 to 630 m", xlabel="Depth (m)", ylabel="Zn (%)")
b.legend(loc="upper right")
save(fig, "duplicates")
Out:
DD0162 at 609.8 m: Zn 0.024 and 0.022 %
DD0162 at 611.8 m: Zn 0.018 and 0.019 %
DD0162 at 613.8 m: Zn 0.086 and 0.082 %
a tolerance of a meter or two would also group neighbors along a hole, such as short intervals on both sides of a
contact. merge="mean" replaces each group by one sample at its first location with the mean grade, and the n
column counts the samples behind each row. "first" keeps the first entry instead, and "max" the largest value.
merged = bt.duplicates(samples, merge="mean")
twins = merged["n"] > 1
means = ", ".join(f"{v:.3f}" for v in merged["ZN_PCT"][twins])
print(f"{len(merged)} samples, {int(twins.sum())} of them merged pairs, Zn {means} %")
Out:
16776 samples, 3 of them merged pairs, Zn 0.023, 0.018, 0.084 %
Total running time of the script: ( 0 minutes 0.187 seconds)
Download Python source code: example_02_04.py