Note
Click here to download the full example code
outlines
a drilling program needs an outline: to clip a surface, to report what lies within the drilled area, or to limit an
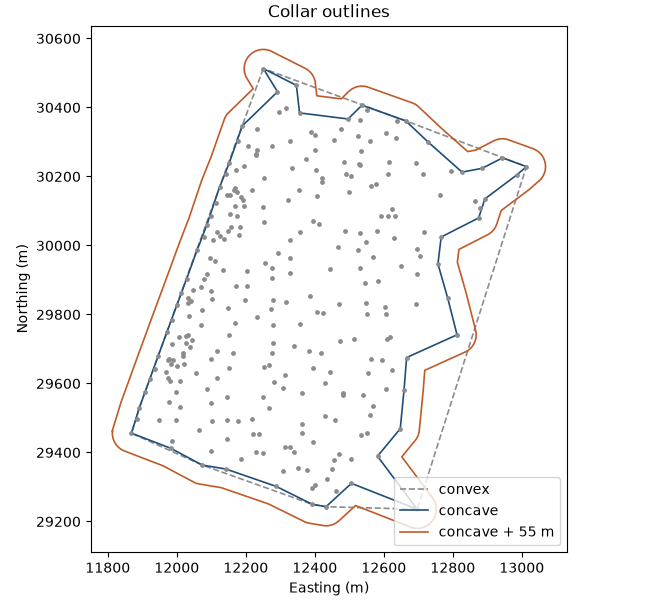
estimate to it. outline draws one around points. the convex hull bridges every gap; a concave outline follows the
edge of the drilling, and a buffer pads it by a fixed distance.
import sys
from pathlib import Path

HERE = Path(__file__).parent if "__file__" in globals() else Path.cwd()
sys.path.insert(0, str(HERE.parents[1]))
import boitata as bt
import matplotlib.pyplot as plt
import numpy as np
from common import ACCENT, GRAY, HIGHLIGHT, map_axes, save

table = bt.datasets.stacked_sulphide_lenses()["collars"]
collars = bt.PointSet.from_table(table)
spacing = np.nanmedian(bt.data_spacing(collars, collars, None))
print(f"{len(collars)} collars, median spacing {spacing:.0f} m")
Out:
289 collars, median spacing 55 m
a concave outline erodes the convex hull from its longest boundary edge inward. max_edge stops it: boundary edges
up to that length stay. at 3 times the median spacing the outline follows the dense west side and cuts into the
sparser east, where holes lie further apart. every collar stays inside or on the outline.
convex = bt.outline(collars)
concave = bt.outline(collars, method="concave", max_edge=3 * spacing)
padded = bt.outline(collars, method="concave", max_edge=3 * spacing, buffer=spacing)
for name, lines in (("convex", convex), ("concave", concave), ("concave + buffer", padded)):
    print(f"{name:17} {lines.area()[0] / 1e6:.2f} km²")
assert (concave.contains(collars) | (concave.distance(collars) < 1e-6)).all()

fig, ax = plt.subplots(figsize=(6.5, 6), layout="constrained")
ax.scatter(*collars.coords[:, :2].T, s=6, color=GRAY, zorder=3)
for lines, color, style, label in (
    (convex, GRAY, "--", "convex"),
    (concave, ACCENT, "-", "concave"),
    (padded, HIGHLIGHT, "-", f"concave + {spacing:.0f} m"),
):
    ring = lines.parts[0]
    ax.plot(*np.vstack([ring, ring[:1]])[:, :2].T, color=color, ls=style, lw=1.2, label=label)
map_axes(ax, "Collar outlines")
ax.legend(loc="lower right")
save(fig, "outlines")
Out:
convex            0.94 km²
concave           0.78 km²
concave + buffer  1.03 km²
categories draws one outline per label: here the diamond and reverse-circulation programs. the result is one
feature per label, ready for contains or locate.
programs = bt.outline(collars, method="concave", max_edge=3 * spacing, categories="TYPE")
for label, area in zip(programs["TYPE"], programs.area(), strict=True):
    print(f"{label}: {area / 1e6:.2f} km²")
Out:
DD: 0.78 km²
RC: 0.03 km²
Total running time of the script: ( 0 minutes 0.177 seconds)
Download Python source code: example_02_18.py