Note
Click here to download the full example code
desurveying drill holes
the stacked sulphide lenses: 244 diamond holes up to 958 m long, which flatten and swing clockwise as they deepen, and 45 short RC holes. desurveying turns each collar and its survey stations (depth, dip positive down, azimuth clockwise from north) into a path, so any depth down a hole has coordinates.
import sys
from pathlib import Path

HERE = Path(__file__).parent if "__file__" in globals() else Path.cwd()
sys.path.insert(0, str(HERE.parents[1]))
import boitata as bt
import matplotlib.pyplot as plt
import numpy as np
from common import ACCENT, GRAY, LIGHT, map_axes, save
Drillholes desurveys each hole from its collar and survey. paths gives the position of each survey station.
the deepest hole, DD0027, flattens from 55° to 46° and swings from azimuth 290° to 296° on its way down:
data = bt.datasets.stacked_sulphide_lenses()
collar, survey = data["collars"], data["surveys"]
dh = bt.Drillholes.from_tables(data, intervals=None)
paths = dh.paths()
print(dh)
last = np.flatnonzero(paths["HOLE_ID"] == "DD0027")[[0, 1, -2, -1]]
station = np.flatnonzero(survey["HOLE_ID"] == "DD0027")[[0, 1, -2, -1]]
for i, j in zip(last, station):
    print(
        f"{paths['depth'][i]:6.1f} m  dip {survey['DIP'][j]:5.2f}  azimuth {survey['AZIMUTH'][j]:6.2f}"
        f"  ->  x {paths['x'][i]:8.1f}  y {paths['y'][i]:8.1f}  z {paths['z'][i]:6.1f}"
    )
Out:
Drillholes(289 holes, 0 intervals)
   0.0 m  dip 55.18  azimuth 289.92  ->  x  12696.7  y  29235.4  z  403.5
  30.0 m  dip 54.71  azimuth 290.76  ->  x  12680.5  y  29241.4  z  378.9
 930.0 m  dip 46.08  azimuth 296.88  ->  x  12155.4  y  29473.2  z -312.6
 958.1 m  dip 45.68  azimuth 296.29  ->  x  12137.9  y  29482.0  z -332.7
between stations the path depends on the method. minimum curvature, the default, bends along a circular arc.
tangential holds each station's direction down to the next, and balanced tangential gives half of each segment to
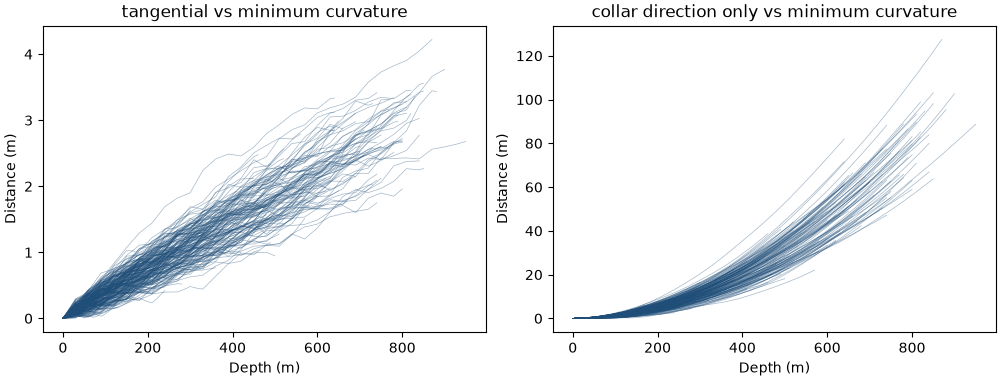
each end. at places any depth on the path, here the end of each hole. the plot adds a hole drilled straight from
its collar direction, as if never surveyed:
holes, length = list(collar["HOLE_ID"]), collar["LENGTH"]
reference = dh.at(holes, length)
collar_station = np.cumsum(survey["DEPTH"] == 0) - 1
unsurveyed = bt.Table(
    {
        "HOLE_ID": survey["HOLE_ID"],
        "DEPTH": survey["DEPTH"],
        "DIP": survey["DIP"][survey["DEPTH"] == 0][collar_station],
        "AZIMUTH": survey["AZIMUTH"][survey["DEPTH"] == 0][collar_station],
    }
)
alternatives = {
    "tangential": bt.Drillholes(collar, survey, method="tangential"),
    "balanced_tangential": bt.Drillholes(collar, survey, method="balanced_tangential"),
    "collar direction only": bt.Drillholes(collar, unsurveyed),
}
for name, other in alternatives.items():
    shift = np.linalg.norm(other.at(holes, length) - reference, axis=1)
    print(
        f"{name:>21}: end of hole {np.median(shift):7.3f} m from minimum curvature (median), {shift.max():7.3f} m max"
    )
Out:
           tangential: end of hole   1.345 m from minimum curvature (median),   4.211 m max
  balanced_tangential: end of hole   0.003 m from minimum curvature (median),   0.011 m max
collar direction only: end of hole  17.181 m from minimum curvature (median), 130.097 m max
with stations every 30 m, tangential ends at most 4.2 m from minimum curvature and balanced tangential within about 1 cm. ignoring the survey puts a hole's end up to 130 m away. both gaps grow with depth:
long = collar["TYPE"] == "DD"
fig, axes = plt.subplots(1, 2, figsize=(10, 3.8), layout="constrained")
for ax, name in zip(axes, ("tangential", "collar direction only")):
    for h, total in zip(np.array(holes)[long], length[long]):
        depth = np.arange(0, total, 10.0)
        at = [h] * len(depth)
        shift = np.linalg.norm(alternatives[name].at(at, depth) - dh.at(at, depth), axis=1)
        ax.plot(depth, shift, color=ACCENT, lw=0.5, alpha=0.4)
    ax.set(title=f"{name} vs minimum curvature", xlabel="Depth (m)", ylabel="Distance (m)")
save(fig, "divergence")
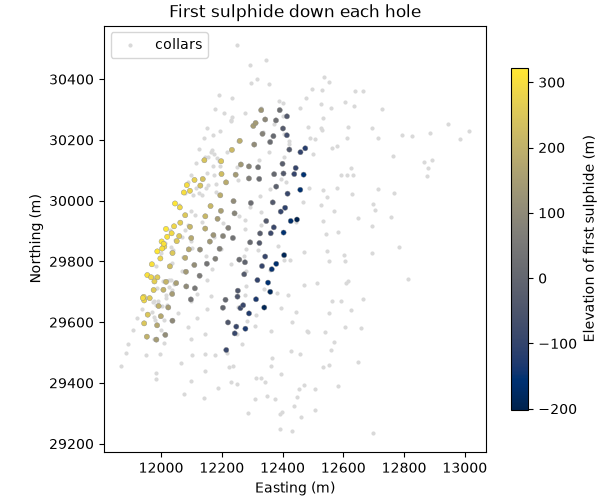
at also places logged contacts. the top of the first sulphide (MS, SMS or STR) down each hole traces the
hanging wall of the upper lens, which deepens to the east-southeast:
lith = data["lithology"]
sulphide = np.isin(lith["LITH"], ["MS", "SMS", "STR"])
hole_ids = lith["HOLE_ID"][sulphide]
first = np.r_[True, hole_ids[1:] != hole_ids[:-1]]
top = dh.at(list(hole_ids[first]), lith["FROM"][sulphide][first])
print(
    f"{len(top)} holes reach sulphide, from {top[:, 2].max():.0f} m down to {top[:, 2].min():.0f} m elevation"
)

fig, ax = plt.subplots(figsize=(6, 5), layout="constrained")
ax.scatter(collar["X"], collar["Y"], s=4, color=LIGHT, label="collars")
points = ax.scatter(top[:, 0], top[:, 1], c=top[:, 2], s=14, cmap="cividis", edgecolor=GRAY, lw=0.3)
fig.colorbar(points, ax=ax, shrink=0.8, label="Elevation of first sulphide (m)")
map_axes(ax, "First sulphide down each hole")
ax.legend(loc="upper left")
save(fig, "contacts")
Out:
150 holes reach sulphide, from 322 m down to -201 m elevation
Total running time of the script: ( 0 minutes 0.444 seconds)
Download Python source code: example_02_02.py