Note
Click here to download the full example code
hole traces with deviation flags
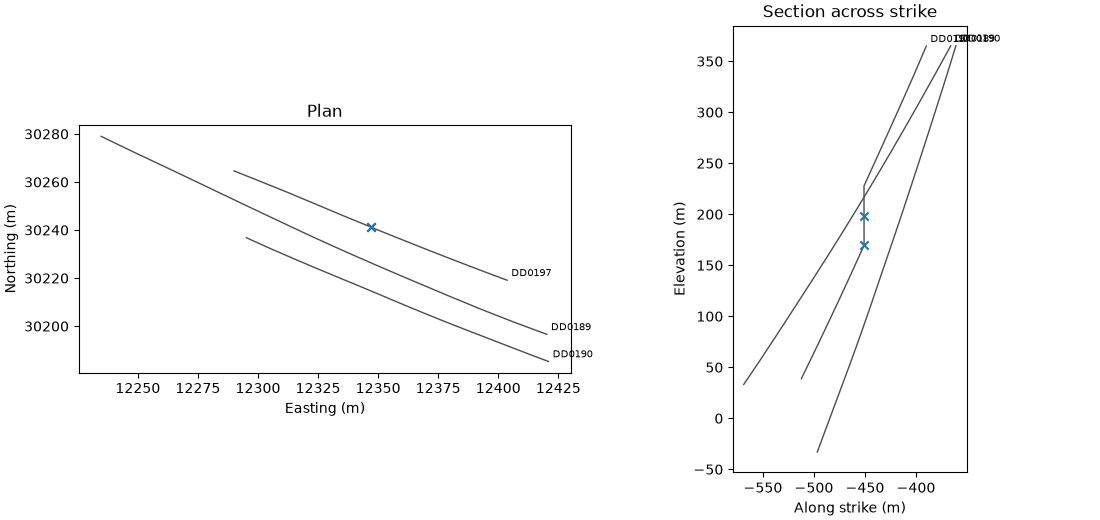
bt.plot.holes generalizes the single hand-rolled trace of checking drill holes (one hole, ax.plot(path["x"], path["z"])) to any
set of holes at once: grouped by hole, one line each, labeled, in plan or projected on a section, with extra points
marked on top.
import sys
from pathlib import Path

HERE = Path(__file__).parent if "__file__" in globals() else Path.cwd()
sys.path.insert(0, str(HERE.parents[1]))
import boitata as bt
import matplotlib.pyplot as plt
import numpy as np
from common import save
the flagged stations
check_drillholes (checking drill holes) flags two survey stations of DD0197, where the azimuth flips and back. their
positions come from Drillholes.at, at the measured depths of the flagged stations. bt.plot.holes knows nothing
about deviation; it takes the points to mark.
data = bt.datasets.stacked_sulphide_lenses(raw=True)
collar, survey = data["collars"], data["surveys"]
flags, _, _ = bt.check_drillholes(
    collar, survey, {"assays": data["assays"], "lithology": data["lithology"]}, max_depth="LENGTH"
)
deviated = flags["survey"]["deviation"]
flagged_holes = survey["HOLE_ID"][deviated]
flagged_depths = survey["DEPTH"][deviated]
print(f"{deviated.sum()} flagged stations, in {sorted(set(flagged_holes))}")

drillholes = bt.Drillholes.from_tables(data, intervals=None)
marked = drillholes.at(list(flagged_holes), flagged_depths)
Out:
2 flagged stations, in ['DD0197']
plan and section
the holes within 40 m of DD0197's collar, in plan view and on a section across strike (113°, as in contact surfaces,
domain cleanup and domain change tables) through it. each view takes one call instead of one ax.plot per hole.
at_dd0197 = collar["HOLE_ID"] == "DD0197"
x0, y0, z0 = (float(collar[c][at_dd0197][0]) for c in ("X", "Y", "Z"))
near = np.hypot(collar["X"] - x0, collar["Y"] - y0) < 40.0
nearby = set(collar["HOLE_ID"][near])

paths = drillholes.paths()
local = paths.filter(np.isin(paths["HOLE_ID"], list(nearby)))

fig, axes = plt.subplots(1, 2, figsize=(11, 5.2), layout="constrained")
bt.plot.holes(local, mark=marked, ax=axes[0])
axes[0].set_title("Plan")
bt.plot.holes(local, plane=((x0, y0, z0), 113.0, 90.0), mark=marked, ax=axes[1])
axes[1].set_title("Section across strike")
save(fig, "traces")
Total running time of the script: ( 0 minutes 0.179 seconds)
Download Python source code: example_02_17.py