Note
Click here to download the full example code
polygons
a coal lease: 295 boreholes, each tagged with the mining method its seam suits, a 48-vertex lease boundary and a 100 m grid. polygons select what lies in the lease and measure how far each point is from its edge, and domains spread from the holes to the grid.
import sys
from pathlib import Path

HERE = Path(__file__).parent if "__file__" in globals() else Path.cwd()
sys.path.insert(0, str(HERE.parents[1]))
import boitata as bt
import matplotlib.pyplot as plt
import numpy as np
from common import ACCENT, GRAY, HIGHLIGHT, INK, LIGHT, map_axes, save
inside the lease
the boundary is a closed Polylines. its single part is the (n, 2) ring that point_in_polygon tests points
against, with the even-odd rule.
data = bt.datasets.coal_seam_thickness()
holes, grid, boundary = data["boreholes"], data["grid"], data["boundary"]
print(boundary)
lease = boundary.parts[0][:, :2]
xy, centers = holes.coords[:, :2], grid.coords[:, :2]
inside = bt.point_in_polygon(centers, lease)
print(f"{inside.sum()} of {len(grid)} cells inside, {inside.sum() * 100 * 100 / 1e6:.1f} km²")
print(f"agreement with the INSIDE flag: {np.mean(inside == (grid['INSIDE'] == 1)):.1%}")
print(f"{bt.point_in_polygon(xy, lease).sum()} of {len(xy)} holes inside")


def outline(ax, ring, **kwargs):
    ax.plot(*np.vstack([ring, ring[:1]]).T, **kwargs)
Out:
Polylines(1 features, 1 parts, crs: none)
7162 of 10800 cells inside, 71.6 km²
agreement with the INSIDE flag: 100.0%
295 of 295 holes inside
distance to the boundary
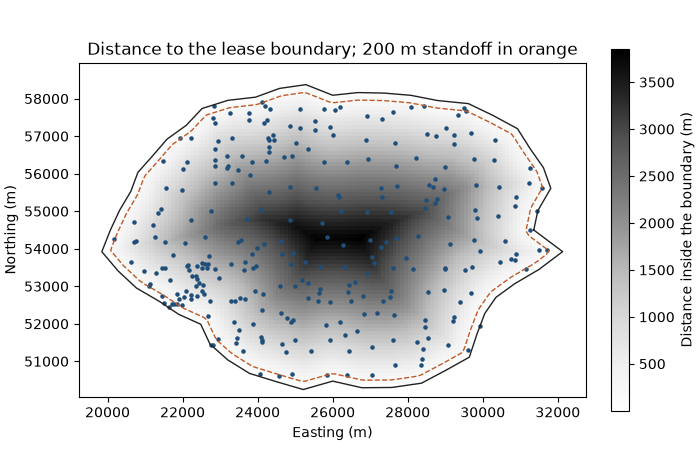
polygon_distance is the plan distance to the nearest edge; with signed=True points inside are negative. a
200 m standoff along the boundary, where no mining is allowed, is the cells within 200 m inside it.
distance = bt.polygon_distance(centers, lease, signed=True)
standoff = (distance > -200) & (distance < 0)
print(f"standoff: {standoff.sum()} cells, {standoff.sum() * 100 * 100 / 1e6:.1f} km²")
to_edge = -bt.polygon_distance(xy, lease, signed=True)
print(
    f"holes from the boundary: {to_edge.min():.1f} to {to_edge.max():.0f} m, {np.sum(to_edge < 200)} within 200 m"
)

fig, ax = plt.subplots(figsize=(7, 4.6), layout="constrained")
bt.plot.section(grid, np.where(inside, -distance, np.nan), ax=ax, colorbar=False, cmap="Greys")
fig.colorbar(ax.collections[0], ax=ax, shrink=0.8, label="Distance inside the boundary (m)")
ax.contour(
    grid.grid(grid.x)[0],
    grid.grid(grid.y)[0],
    grid.grid(distance)[0],
    levels=[-200],
    colors=HIGHLIGHT,
    linewidths=1,
)
outline(ax, lease, color=INK, lw=1)
ax.scatter(*xy.T, s=5, color=ACCENT)
map_axes(ax, "Distance to the lease boundary; 200 m standoff in orange")
save(fig, "distance")
Out:
standoff: 640 cells, 6.4 km²
holes from the boundary: 0.1 to 3775 m, 23 within 200 m
domains from the holes
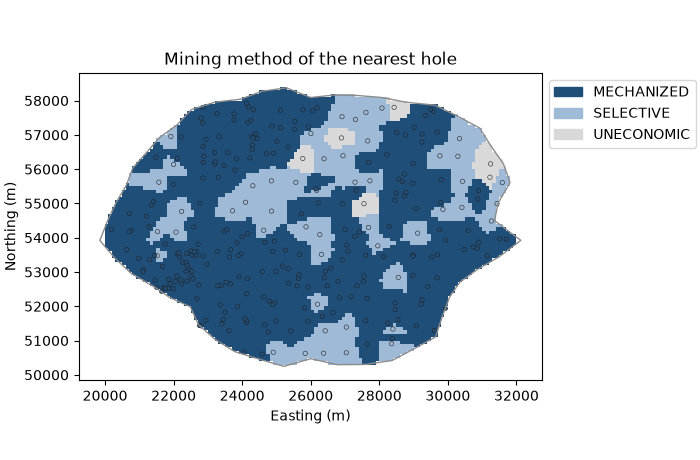
assign_domain gives each target the domain of its nearest sample, read from the domain_column of the holes.
here the targets are the cells in the lease and the domain is the mining method. labels come back as a list, with
a confidence per target: the share of the n nearest holes (5 by default) that carry its label.
cells = grid.filter(inside)
labels, confidence = bt.assign_domain(cells, coords=holes, domain_column="CATEGORY")
methods = bt.Categories(["MECHANIZED", "SELECTIVE", "UNECONOMIC"], colors=[ACCENT, "#9ebad6", LIGHT])
codes = methods.encode(labels)
logged = methods.encode(holes["CATEGORY"])
for name, cell_share, hole_share in zip(
    methods.names, methods.shares(codes), methods.shares(logged), strict=True
):
    print(f"{name:>10}: {cell_share:6.1%} of the lease, {hole_share:6.1%} of the holes")

fig, ax = plt.subplots(figsize=(7, 4.6), layout="constrained")
bt.plot.section(cells, codes, scheme=methods, colorbar=False, ax=ax)
outline(ax, lease, color=GRAY, lw=1)
cmap, norm = bt.plot.category_colors(methods)
ax.scatter(*xy.T, c=logged, cmap=cmap, norm=norm, s=10, edgecolors=INK, linewidths=0.4)
bt.plot.category_legend(methods, ax, loc="upper left", bbox_to_anchor=(1, 1))
map_axes(ax, "Mining method of the nearest hole")
save(fig, "domains")
Out:
MECHANIZED:  69.7% of the lease,  81.0% of the holes
 SELECTIVE:  26.9% of the lease,  16.9% of the holes
UNECONOMIC:   3.4% of the lease,   2.0% of the holes
MECHANIZED holes are 81.0 % of the holes, but their domain covers 69.7 % of the lease, because the infill went
where the seam is thick. counting cells instead of holes declusters the shares.
majority vote
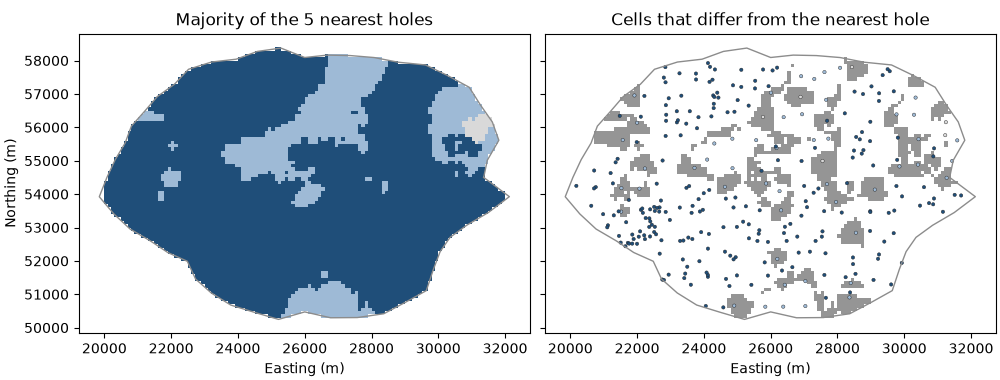
method="majority" takes the most frequent label among the n nearest holes instead, and a tie goes to the label
of the nearest hole. a lone hole among holes of another method no longer claims its own patch.
majority, agreement = bt.assign_domain(cells, coords=holes, domain_column="CATEGORY", method="majority")
changed = np.array(labels) != np.array(majority)
print(f"{changed.sum()} of {len(cells)} cells change label ({changed.mean():.1%})")
print(f"mean confidence: nearest {confidence.mean():.2f}, majority {agreement.mean():.2f}")
for name, share in zip(methods.names, methods.shares(methods.encode(majority)), strict=True):
    print(f"{name:>10}: {share:6.1%} of the lease")

fig, (a, b) = plt.subplots(1, 2, figsize=(10, 3.8), sharey=True, layout="constrained")
bt.plot.section(cells, methods.encode(majority), scheme=methods, colorbar=False, ax=a)
outline(a, lease, color=GRAY, lw=1)
map_axes(a, "Majority of the 5 nearest holes")
bt.plot.section(cells, changed.astype(float), ax=b, colorbar=False, cmap="Greys", vmin=0, vmax=2)
outline(b, lease, color=GRAY, lw=1)
b.scatter(*xy.T, c=logged, cmap=cmap, norm=norm, s=6, edgecolors=INK, linewidths=0.3)
map_axes(b, "Cells that differ from the nearest hole")
b.set_ylabel("")
save(fig, "majority")
Out:
1314 of 7162 cells change label (18.3%)
mean confidence: nearest 0.75, majority 0.81
MECHANIZED:  80.4% of the lease
 SELECTIVE:  18.8% of the lease
UNECONOMIC:   0.7% of the lease
the changed cells sit around isolated SELECTIVE holes, now outvoted by their MECHANIZED neighbors, and
MECHANIZED grows from 69.7 % to 80.4 % of the lease. majority smooths the map but gives back the declustering:
where the drilling is dense, one method wins most votes.
a polygon with a hole
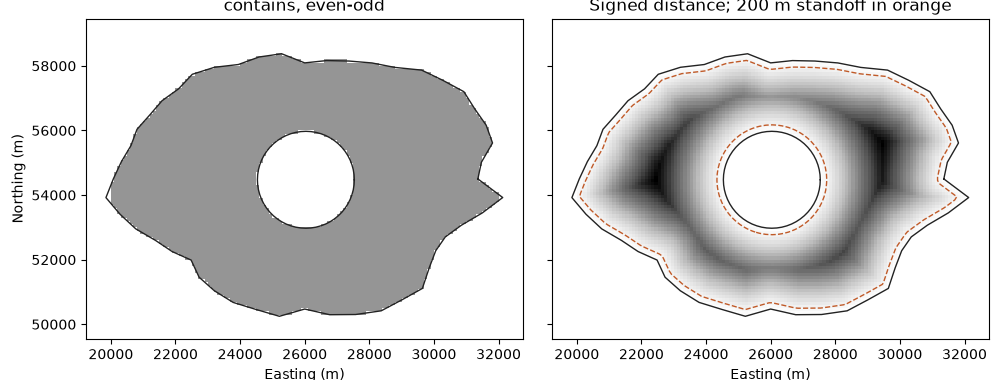
a lease often excludes an area inside it, here a 1.5 km circle around a point in the middle. the exclusion is a
second closed part of the lease feature. Polylines decide inside by even-odd counting over a feature's closed
parts, so a ring inside another is a hole. contains leaves the exclusion out, area subtracts it and
distance measures to the nearest ring, negative inside, so the 200 m standoff now runs along both rings.
PolygonSelector, point_in_polygon and BlockModel.subblock take the same Polylines.
center = lease.mean(axis=0)
angle = np.linspace(0, 2 * np.pi, 60, endpoint=False)
exclusion = center + 1500 * np.column_stack([np.cos(angle), np.sin(angle)])
leased = bt.Polylines([lease, exclusion], closed=True, features=[0, 0], attributes={"name": ["lease"]})
kept = leased.contains(centers)
in_exclusion = bt.point_in_polygon(centers, exclusion)
print(
    f"area: {boundary.area()[0] / 1e6:.2f} km² lease, {leased.area()[0] / 1e6:.2f} km² net of the exclusion"
)
print(
    f"cells kept: {kept.sum()}, {np.sum(kept & in_exclusion)} of the {in_exclusion.sum()} in the exclusion zone"
)
print(f"PolygonSelector agrees: {np.array_equal(bt.PolygonSelector(leased).contains(centers), kept)}")
signed = leased.distance(centers, signed=True)
standoff = (signed > -200) & (signed < 0)
print(f"standoff along both rings: {standoff.sum()} cells, {standoff.sum() * 100 * 100 / 1e6:.1f} km²")

fig, (a, b) = plt.subplots(1, 2, figsize=(10, 3.8), sharey=True, layout="constrained")
bt.plot.section(grid, kept.astype(float), ax=a, colorbar=False, cmap="Greys", vmin=0, vmax=2)
bt.plot.section(grid, np.where(kept, -signed, np.nan), ax=b, colorbar=False, cmap="Greys")
b.contour(
    grid.grid(grid.x)[0],
    grid.grid(grid.y)[0],
    grid.grid(signed)[0],
    levels=[-200],
    colors=HIGHLIGHT,
    linewidths=1,
)
for ax, title in ((a, "contains, even-odd"), (b, "Signed distance; 200 m standoff in orange")):
    outline(ax, lease, color=INK, lw=1)
    outline(ax, exclusion, color=INK, lw=1)
    map_axes(ax, title)
b.set_ylabel("")
save(fig, "hole")
Out:
area: 71.65 km² lease, 64.59 km² net of the exclusion
cells kept: 6458, 0 of the 704 in the exclusion zone
PolygonSelector agrees: True
standoff along both rings: 843 cells, 8.4 km²
Total running time of the script: ( 0 minutes 1.862 seconds)
Download Python source code: example_02_08.py